I pledge allegiance to the flag of the United Deaths of America🏴
US democide 2020: Part 2 by Ginny Stoner

US democide 2020: Part 2-Excess deaths demystified

Everything beyond this point was written by Virginia (Ginny) Stoner and proudly pasted into the post by Proton Magic.
Please review part 1 of this series by Ginny Stoner:

How democide fits into a larger set of hidden narratives with a section by Ginny:

This is Part 2 of a 3-part series on the possible democide that occurred in the US under the guise of COVID-19.
This part demystifies the concept of “excess deaths,” and shows how it has been used to conceal the shocking death numbers covered in Part 1. Part 3 covers the main strategies being used in alternative media to conceal the death numbers.
To calculate “excess” deaths for the Covid years, we have to first estimate how many deaths would have occurred in 2020—2022, if they had been normal years, then subtract the estimated normal number of deaths from the actual number of deaths that occurred. If the result is a positive number, there were “excess” deaths (more deaths than expected), and if the number is negative, there were “deficit” deaths (fewer deaths than expected).
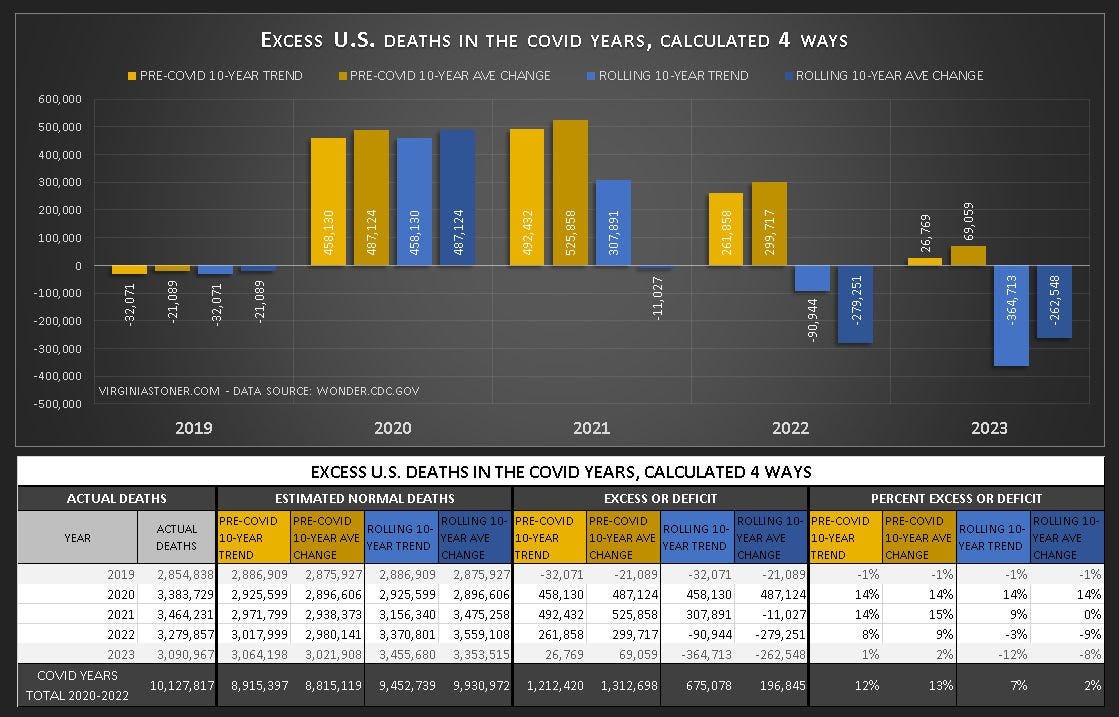
Chart 1: Actual, normal, and excess deaths
Chart 1 below contains both a chart of excess deaths, and a table showing the numbers behind the chart. In gold are excess deaths based on pre-Covid numbers only, and in blue are excess deaths based on the previous 10 years, including the Covid years (the comparison period “rolls” forward with each new year).
Excess deaths were calculated using 2 simple methods: the 10-year trend, and the 10-year average yearly change in deaths. No adjustments were made for the age of the population or anything else.
The table in the lower part of Chart 3 shows the actual number of deaths from 2019 thru 2023, along with 4 different estimates of “normal” deaths, the difference between actual deaths and normal deaths (the excess or deficit, which is illustrated in the chart), and the percent of the excess or deficit.
The pre-Covid and rolling methods compared
For the Pre-Covid 10-year trend (in light gold) and average yearly change (in dark gold), the expected number of normal deaths during the Covid years was estimated using the trend and average change from 2010—2019. (Excess deaths in 2019, which were included for context, were calculated using the 10-year trend and average change from 2009-2018.) Although it is not typical to use the same 10-year period to calculate excess deaths in multiple years, it was necessary in these circumstances, to compare mortality during the Covid years with the pre-Covid normal.
The Rolling 10-year trend (in light blue) and average yearly change (in dark blue) were also used to calculate excess deaths—meaning instead of using the pre-Covid years of 2010—2019 to estimate normal deaths in all 3 Covid years, the 10-year period “rolls” with each new year, and uses the most recent 10-years to estimate normal deaths, including deaths during the Covid years. This is the usual way to do it, so you will probably see similar excess death numbers elsewhere.
Excess deaths in 2020: very high, regardless of method

In 2019 and 2020, the “Rolling” methods and the “Pre-Covid” methods used the same 10-year period to estimate normal deaths, so the results are identical. Both the trend and average change indicate there were an unprecedented number of excess deaths in 2020—458 thousand, according to the trend, or 487 thousand, according to the average change—an incredible 14% excess deaths, in either case.
In fact, any method of estimating excess deaths would agree there were a lot of them in 2020, if the method is based solely on historical data, because deaths had been quite stable for well over a decade, making the prediction of 2020 deaths straightforward.
“The creatures responsible for 1.2 million excess deaths would want statistical predictions of how many people would be eliminated in the operation.”
- Ginny Stoner

The only way any method could find there were little or no excess deaths in 2020—regardless of what Dr. David Martin said—would be if they used a mathematical model or Bayesian voodoo to predict an abnormally large number of deaths in 2020. If a prediction like that was made prior to Spring 2020, when excess deaths began, I would be very interested in seeing it. If a democide did occur, you can bet this type of analysis is out there, since the creatures responsible for 1.2 million excess deaths would want statistical predictions of how many people would be eliminated in the operation.
Excess deaths in 2021 and beyond
Compared to the pre-Covid normal, excess deaths were a little higher in 2021 than they were in 2020, and were still pretty high in 2022—with a total of 1.2 to 1.3 million excess deaths during the Covid years.
On the other hand, using rolling methods, there were either far fewer or no excess deaths in 2021, and deficit deaths in 2022—resulting in just 197 to 675 thousand excess deaths during the Covid years, most of them in 2020.
Basically, what happened is that 2 anomalous years of extraordinarily high deaths in 2020 and 2021 forever increased our expectations of how many deaths, and what death rate, are considered normal in the US.
In 2021, the rolling methods used deaths from 2011—2020 to estimate normal deaths—and because deaths were so high in 2020, and had been steadily increasing for the last decade, it caused the number of expected deaths in 2021 to be very high—much higher than deaths actually were.
The same thing happened in 2022, when 2 years of extraordinarily high deaths were used to predict an even higher number of deaths that year—when in reality, deaths declined dramatically in 2022, and by 2023, had nearly returned to pre-Covid normal levels.
I think it’s important to look at excess deaths based on the pre-Covid normal, as well as using typical rolling methods, since rolling methods standing alone can be misleading because of the extreme anomaly in deaths during the Covid years. I doubt the CDC will do a similar comparison—since the sharp decline in excess deaths in 2021 and 2022, although just an artifact of the massive increase in deaths in 2020 and 2021, can be used to imply the Covid vaccines did something beneficial.
NOTES
HOW TO RUN A SAVED WONDER SEARCH: Click the link and agree to the terms of service—no registration is required. The search should run automatically, and take you to the “Results” tab, where you can view, copy, or download the results. To see a detailed description of the search criteria, or to modify the search, go to the “Request Form” tab.
1) US all-cause deaths and death rate per 100,000 - 1999 thru 2023.
For deaths from 1999-2020, run this search: https://wonder.cdc.gov/controller/saved/D76/D403F967. Citation: Centers for Disease Control and Prevention, National Center for Health Statistics. National Vital Statistics System, Mortality 1999-2020 on CDC WONDER Online Database, released in 2021. Data are from the Multiple Cause of Death Files, 1999-2020, as compiled from data provided by the 57 vital statistics jurisdictions through the Vital Statistics Cooperative Program. Accessed at http://wonder.cdc.gov/ucd-icd10.html on Aug 26, 2024 9:21:28 PM
For deaths from 2021-2023, run this search: https://wonder.cdc.gov/controller/saved/D176/D403F968. Citation: Centers for Disease Control and Prevention, National Center for Health Statistics. National Vital Statistics System, Provisional Mortality on CDC WONDER Online Database. Data are from the final Multiple Cause of Death Files, 2018-2022, and from provisional data for years 2023-2024, as compiled from data provided by the 57 vital statistics jurisdictions through the Vital Statistics Cooperative Program. Accessed at http://wonder.cdc.gov/mcd-icd10-provisional.html on Aug 26, 2024 9:28:18 PM
END OF PART 2
Postscript by Proton Magic
Ginny Stoner is a prolific investigator and writer on the CDC death data. She has a Bachelors in psychology, a Masters in social and personality psychology where she focused on research design and data analysis, and a Doctorate of Law degree.
I encourage everyone to spend some time on her well written site. She is always quite gracious in helping clarify questions and comments and I will largely defer to her to handle on-topic questions in the comments.
While I understand the data she presents, I am not an expert on the validity of this kind of investigation. I do know that there can be different interpretations and fuzzy areas on data collection that are very difficult to either prove or debunk.
One last bedtime story:
Ginny fights off the Cling-ons to bad data as Captain of the Enterprise:

The “race to 5G” towers are line of sight directed energy weapons - their precision can target you and you alone inside a crowd of people. In 2020, there was a study in a major journal - now scrubbed from the internet - that found that 5G can induce cold symptoms. As many of you know, Wuhan China was the first city to install 5G and was also ground zero for COVID.
What they were doing to make the pandemic seem real - and this is why these death towers are now installed all over the place - is they were following people around via their cell signature through the 5G grid and zapping them with microwaves to induce COVID symptoms.
This way most people “knew” someone diagnosed with COVID and it made the pandemic feel real (and in a way I guess it was, just from a different attack vector).
They would pick a person from a family, give them “COVID”, and then a week later they would pick someone that person came in contact with and give it to them as well. This occurred with families/friends all over the world, and made the transmission chain plausible.
The 2020 pandemic was all a contagion illusion created with 5G technology, assaulted victims, backstabbing journalists, false positive factory PCR tests, and word of mouth.
https://old.bitchute.com/video/LY6dTOr8PW7s [10:37mins]
And many lives will be lost because of it:
https://old.bitchute.com/video/y4ecuAj2w6Jc [2:57mins]
COVID Operation Executive Summary
The virus held little danger so to fix this flaw the script was flipped to ensure that all of the preventative measures were overflowing with harm:
The masks were designed to devitalize you mentally, physically, & spiritually.
The propaganda was programmed to wreck your mind and install the “virus”.
The lockdowns were enforced to eviscerate your economies, education, and autonomy.
The injections are intended to erase you.
All of this damage is by design: death by a thousand cuts.
More on this here: https://tritorch.substack.com/p/the-gathering-darkness
We're rats in a maze, you know this as well as anyone PM. Best to you and yours.